Stacked Area charts are fundamentally similar to a standard Area Chart, except for the use of multiple variables in the x-axis instead of a single variable.
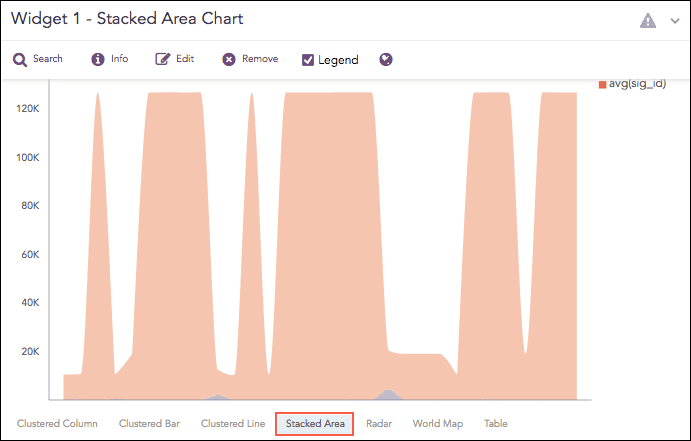
Stacked Area Chart
The following query gives the output shown above.
| chart count(), avg(sig_id) by action
The Stacked Area chart supports two aggregation response types for representation of search results in the visualization. They are:
Response Type |
General Syntax |
|---|---|
| chart aggregation_parameter1, aggregation_parameter2 by grouping_parameter1, grouping_parameter2, ...,grouping_parametern
|
|
| timechart aggregation_parameter1, aggregation_parameter2, .... aggregation_parametern
|
In the Multiple Aggregation with Grouping response type, the x-axis contains the values of the grouping parameter(s), whereas the y-axis consists the scale to measure the value of the aggregation parameters. A unique color represents each aggregation parameter.
sent_datasize=* source_address=* | chart max(sent_datasize), max(received_datasize) by source_
address order by max(sent_datasize), max(received_datasize) desc limit 10
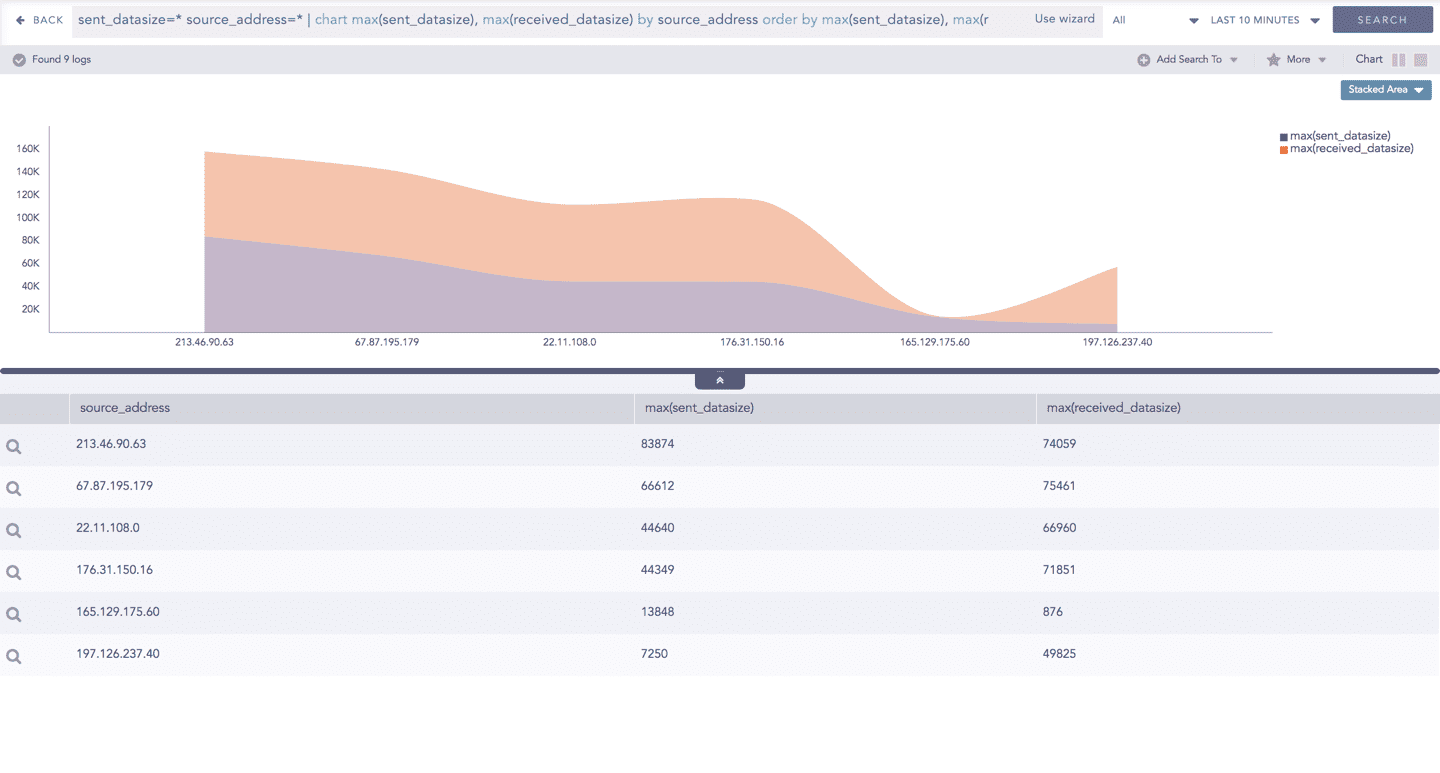
Stacked Area chart for Multiple Aggregation with Grouping
You can refer to Multiple Aggregation with Grouping for more details.
Example:
| timechart count(), avg(datasize)
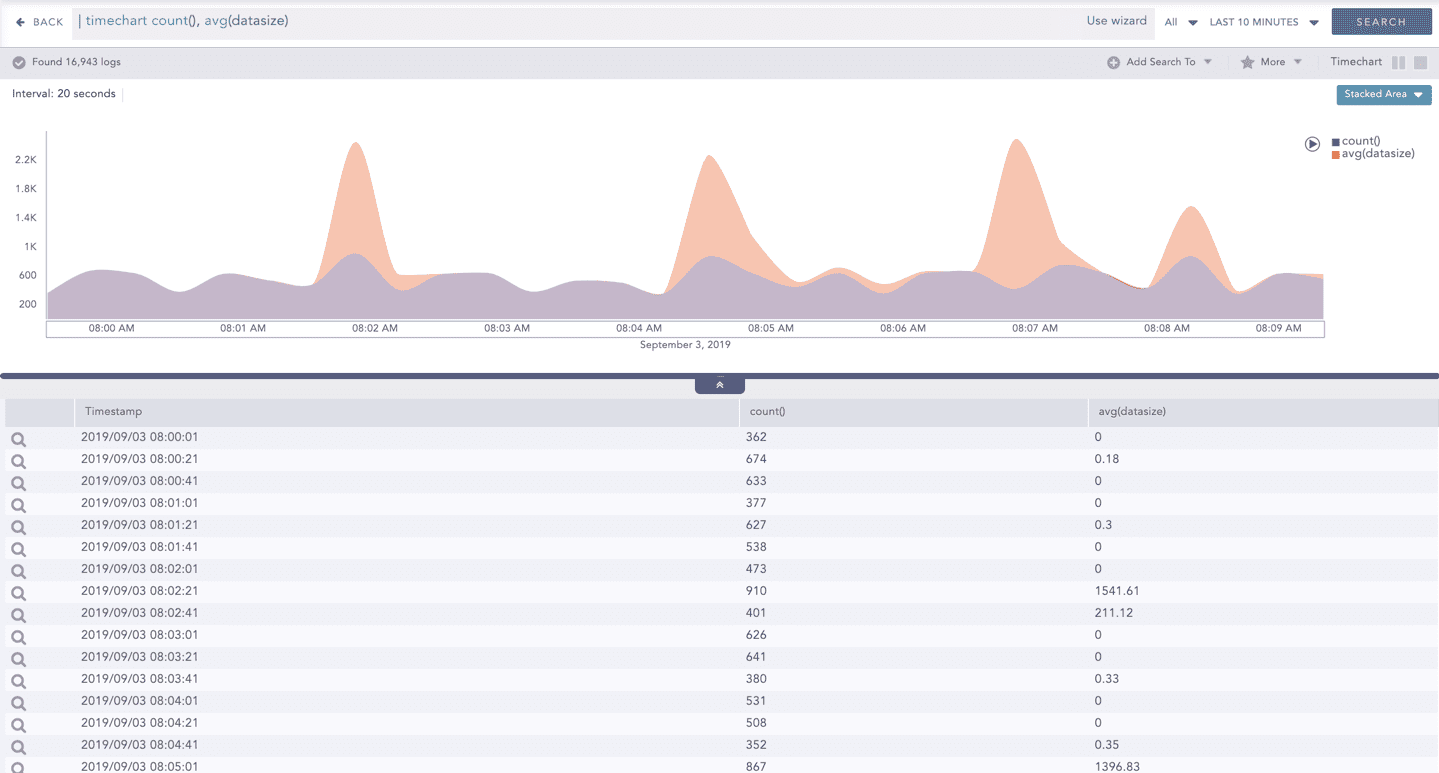
Stacked Area chart for Multiple Aggregation with Grouping
You can refer to Timechart Multiple Aggregation without Grouping for more details.